Hiding a 15 ms Bot Check Behind the Backend
This month at work we put a third-party bot-management check in front of some of our most important API endpoints. Each call to the vendor’s verdict API takes about 15 ms. The check adds about 5 ms on average, and 4 ms at the median, to the requests it covers.
How? We stopped waiting for the verdict before calling the backend. HAProxy asks the vendor and the backend at the same time, then holds on to the backend’s response until the verdict turns up. Below is how that works in HAProxy Lua, why we only do it for reads, and how I measured it (which, embarrassingly, I got wrong twice before getting it right).
Credit where it’s due: a colleague came up with the parallel design and wrote the code. I did the measuring, dug into the latency, and rolled it out to production. I think the idea is handy for more than just bot checks, so I wanted to write it up.
The setup
My employer is a large consumer app. The mobile app talks to a fleet of HAProxy pods on Kubernetes, behind a CDN. HAProxy takes each request and routes it to one of dozens of backend services.
We’re evaluating a bot management service provider. Their HAProxy integration is a Lua module: for each request it calls the vendor’s verdict API over HTTPS, and gets back allow, block or challenge. The stock module does this in order:
client ─▶ HAProxy ─▶ [call verdict API, wait ~15 ms] ─▶ backend ─▶ responseNice and simple, but it means every checked request sits waiting for the vendor before the backend even sees it. On our dev cluster, with every request checked, that added about 14 ms at the median (20 ms at p95). That might not sound like much, but it’s on the requests the app makes as it opens, so it all adds up.
Doing both at once
For the endpoints in question, the backend usually takes longer than the vendor does: about 20 ms at the median, against 15 ms. So why wait for the vendor first?
- When the request comes in, kick off the verdict call in the background and send the request straight on to the backend.
- When the backend answers, hang on to its response until the verdict is in (usually it already is). If the verdict is fine, the response goes out as normal. If it says “block”, we bin the response and send the block page instead.
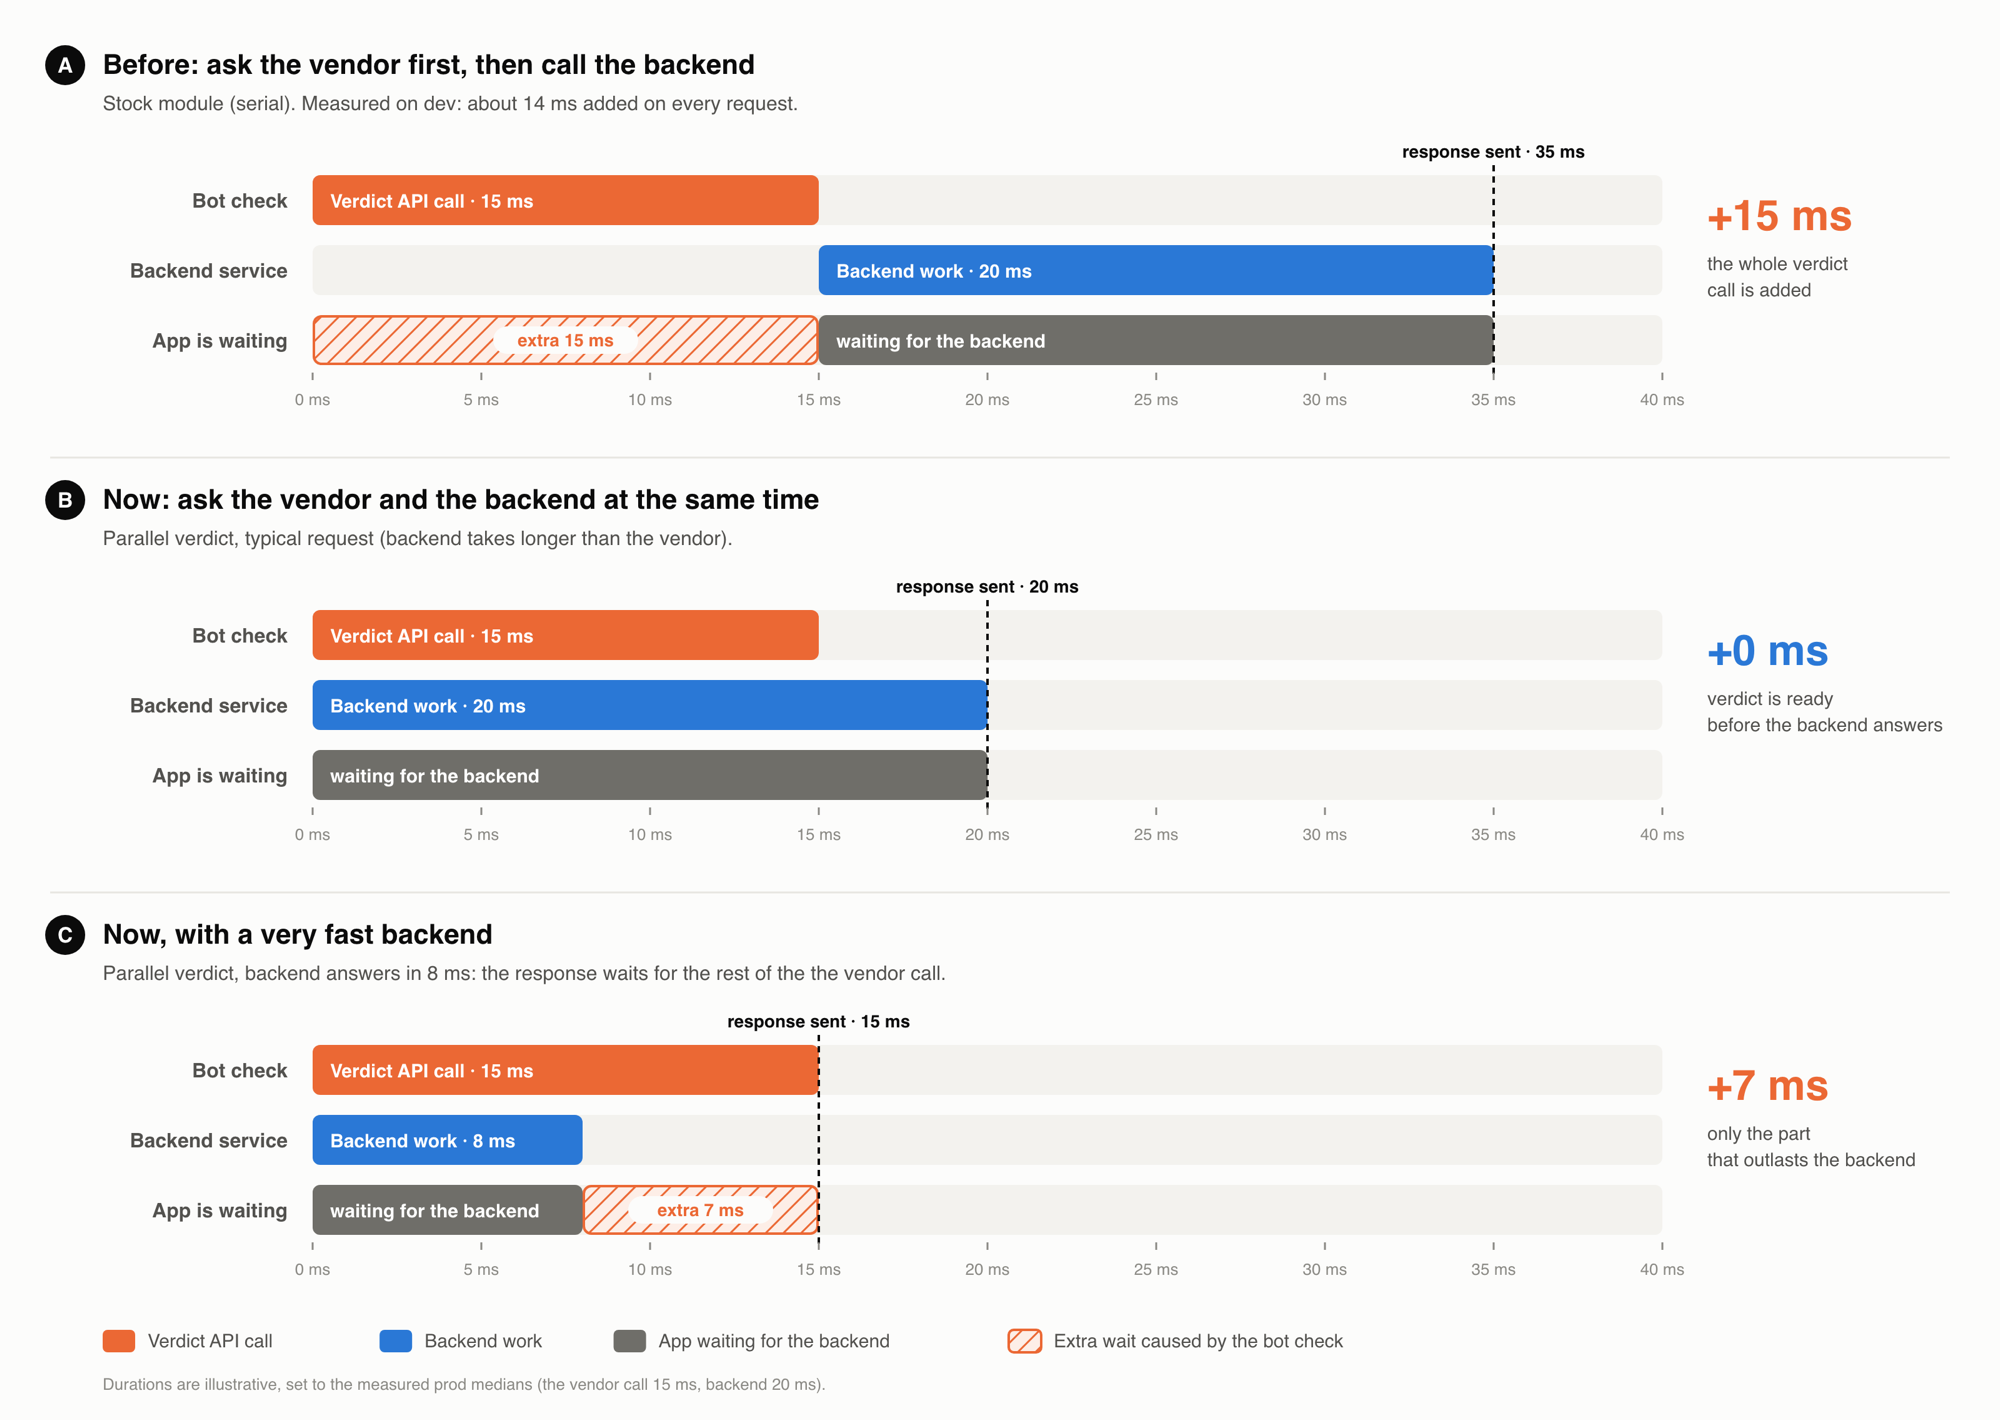
What the user waits for is now max(backend, verdict) instead of backend + verdict:
| Case | One after the other | At the same time |
|---|---|---|
| Typical: backend 20 ms, verdict 15 ms | 35 ms (+15) | 20 ms (+0) |
| Fast backend: 8 ms, verdict 15 ms | 23 ms (+15) | 15 ms (+7) |
Is it safe to send the request before you know it’s a bot?
It depends whether the request reads something or changes something.
- For reads (GET, HEAD, OPTIONS), the backend does the work, but if the verdict says “block” the bot never sees the result. It just gets the block page. Worst case, the backend wasted a bit of effort.
- For writes, once a bot’s POST reaches the backend it’s too late (an account’s been created, or a one-time code sent), whatever we send back afterwards. So writes still wait for the verdict before going anywhere.
The list of methods that can go in parallel lives in config, with a comment so nobody “optimises” writes into it later:
# Methods whose verdict call runs in parallel with the backend (GET is always in the set). Writes
# (POST, PUT, PATCH, DELETE) stay serial: the request waits for the verdict, so a blocked write can
# never reach the backend once enforcement is on. Do not add a write method here unless
# enforcement is off: an async write would already have run on the backend when the block arrives.
presetenv BM_PARALLEL_METHODS "GET,HEAD,OPTIONS"
How it’s built in HAProxy Lua
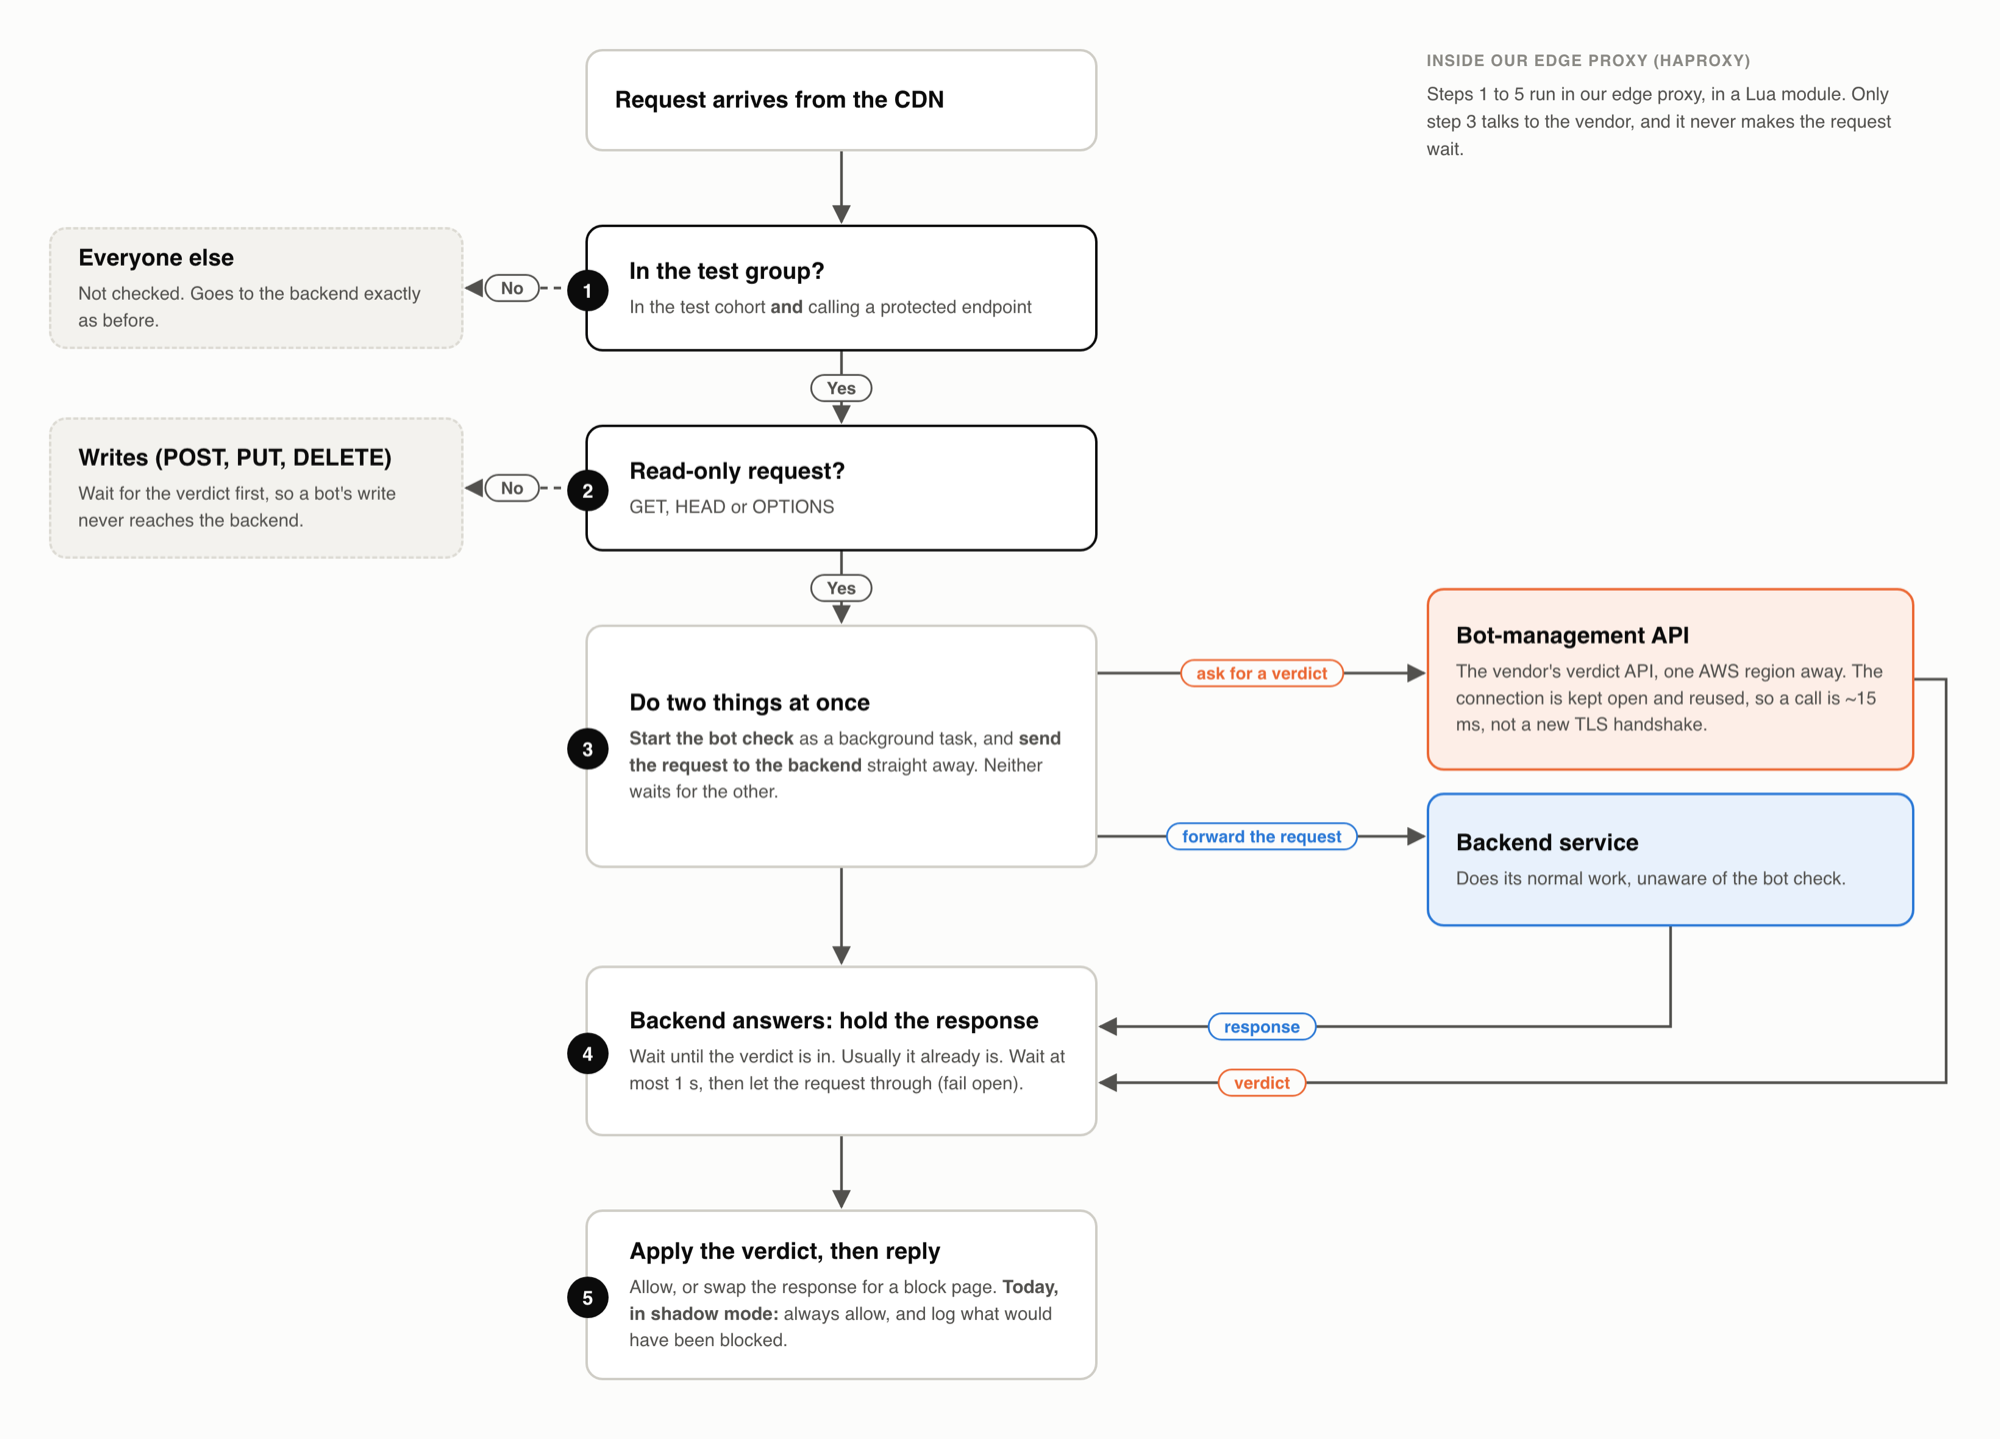
In the HAProxy config, it hooks in twice: once when the request arrives and once when the response comes back.
global
    # Read at load time, so presetenv must come before lua-load.
    presetenv BM_ASYNC_ENABLED "1"
    presetenv BM_ENFORCE "0"                 # shadow mode, see below
    presetenv BM_VERDICT_TIMEOUT_MS "1000"
    # The verdict timeout only bounds the wait for a response. Connecting uses HAProxy's global
    # httpclient settings (defaults: 5 s connect, 3 retries), which made a blackholed vendor
    # cost ~20 s per request in a local test. With these it fails open in ~250 ms.
    httpclient.timeout.connect 250ms
    httpclient.retries 0
    lua-load-per-thread /etc/haproxy-custom-files/bm_module.lua

frontend https
    # Only a small test cohort on protected endpoints is checked; everyone else skips the module.
    http-request  lua.bm_request_handler PROTECT if bm_on bm_cohort
    http-response lua.bm_response_handler          if bm_on bm_cohort
When the request arrives
The bit that makes this possible is core.register_task. It runs a Lua function as its own HAProxy task, outside the request, so the request doesn’t have to wait for it. The task and the request share a small “slot” table, and the task sets done = true when the verdict is back.
local method = util.safe_call(function() return txn.f:method() end) or ""
local needs_call = mode ~= "OBSERVE_ONLY" and session.should_revalidate

if ASYNC_ENABLED and mode == "PROTECT" and needs_call and PARALLEL_METHODS[method] then
    local slot = { done = false, cfg = request_config }
    session.async_slot = slot
    txn:set_var("txn.bm_path", "parallel")          -- logged, so we can prove which path ran
    core.register_task(function(sess, cfg, sl)
        local ok = pcall(verdict_api.fetch, sess, cfg)  -- writes the verdict into sess
        if not ok then sess.verdict_error = true end
        sl.done = true
    end, session, request_config, slot)
    txn:set_priv(session)                           -- hand the session to the response phase
    return                                          -- request continues to the backend NOW
end

-- Everything else (writes, or async disabled) takes the original blocking path:
txn:set_var("txn.bm_path", needs_call and "serial" or "cached")
verdict_api.fetch(session, request_config)
When the response comes back
Wait for the verdict (but not forever), then act on it:
local function now_ms() local t = core.now(); return t.sec * 1000 + t.usec / 1000 end

-- Returns a reply to send instead of the backend response, or nil to let it through.
local function await_parallel_verdict(txn, session)
    local slot = session.async_slot
    if not slot then return nil end
    session.async_slot = nil
    local t0 = now_ms()
    while not slot.done and (now_ms() - t0) < PARALLEL_WAIT_MS do
        core.msleep(1)                      -- yields to HAProxy; doesn't block the thread
    end
    session.parallel_wait_ms = now_ms() - t0
    if not slot.done then
        session.verdict_error = true        -- timed out: fail open, like any vendor failure
    end
    txn:set_var("txn.bm_status", tostring(session.verdict_status
        or (not slot.done and "timeout") or (session.verdict_error and "error") or "skip"))
    log_verdict(txn, session)
    if not slot.done then return nil end
    return enforce_verdict(txn, slot.cfg or config, session)
end
A few other things we ran into along the way:
core.msleep(1)hands control back to HAProxy while it waits, so a held response doesn’t tie up a thread. Polling every 1 ms is part of where the roughly 1 ms of fixed overhead comes from. A queue would be neater, but in another experiment on HAProxy 2.9 we hit a use-after-free crash withQueue:pop_wait, so we stuck with the boring loop.- If anything goes wrong (a timeout, a connection error, a Lua error), the request just goes through. The last thing we want is the bot check taking the app down! The comment in the config above is there for a reason: with HAProxy’s default HTTP client settings, an unreachable vendor turned into 20-second requests in a local test. With a 250 ms connect timeout and no retries, it gives up quickly.
- If the app cancels a request mid-wait, HAProxy stops the waiting Lua and logs “yield not allowed”. That looks scary in the logs, but the app has already moved on, so nobody notices.
- HAProxy’s built-in HTTP client keeps connections to the vendor open, and about 95% of calls in production reused one. Without that, every call would need a fresh TLS handshake to another AWS region.
Shadow mode
Before blocking anything for real, we run everything as if we were blocking, but just log what we would have blocked. That way we find the false positives (like our own QA and test traffic looking like bots) before they lock out real people.
-- Anything but the exact value "0" enforces, so a typo fails toward blocking,
-- not toward silently not blocking.
local ENFORCE = os.getenv("BM_ENFORCE") ~= "0"

-- The one place a verdict turns into a block. Used by the serial, parallel and
-- cached-verdict paths, so shadow mode cannot differ between them.
local function enforce_verdict(txn, cfg, session)
    local kind
    if session.verdict == VERDICT_BLOCK then kind = "block"
    elseif session.verdict == VERDICT_CHALLENGE then kind = "challenge"
    else return nil end
    if not ENFORCE then
        txn:set_var("txn.bm_would_block", kind)   -- logged, request continues
        return nil
    end
    if kind == "block" then return responses.block(txn, cfg, session) end
    return responses.challenge(txn, cfg, session)
end
We did two things on purpose here. Every path goes through that one function, so shadow mode can’t accidentally be on for one path and off for another. And shadow mode only kicks in for the exact value "0", so if someone deletes the setting or makes a typo, it starts blocking. I’d much rather find out that way than spend weeks thinking we’re blocking bots when we’re actually letting everything through.
Measuring how much time it adds
Happily, HAProxy’s access log already had everything I needed, in two of its timers:
%Tris how long the backend took to send its response headers.%Tais the total time HAProxy spent on the request, from accepting it to sending the last byte.
So %Ta − %Tr is everything that wasn’t the backend. On the parallel path, the wait for the verdict happens after the backend has answered, while HAProxy holds the response, so it shows up in %Ta but never in %Tr. Which is exactly what I wanted to measure, and I didn’t have to build anything new. All I added to our JSON log format were the module’s own variables:
log-format '{"timestamp":"%Tl", ... ,"request_time":%TR,"server_response_time":%Tr,"total_active_time":%Ta, ...
            ,"bm_status":"%[var(txn.bm_status),json(utf8s)]","bm_path":"%[var(txn.bm_path),json(utf8s)]"
            ,"bm_would_block":"%[var(txn.bm_would_block),json(utf8s)]"}'
Here are four real requests from production:
| Request | Backend | Total | Added | What it shows |
|---|---|---|---|---|
| Checked, fast backend | 6 ms | 16 ms | 10 ms | The backend finished first, so the response waited for the rest of the verdict. |
| Checked, slow backend | 70 ms | 72 ms | 2 ms | The verdict was back long before the backend; almost nothing added. |
| Not checked, same endpoint | 8 ms | 8 ms | 0 ms | Baseline: HAProxy itself adds about nothing. |
| Checked, slow tail | 9 ms | 69 ms | 60 ms | A slow vendor call shows through a fast backend. This is the p99. |
Then I compared requests that were checked with ones that weren’t, over the same 6 hours, on the same endpoints, through the same proxies:
| Checked | Not checked | Difference | |
|---|---|---|---|
| Added latency, mean | 6.1 ms | 0.6 ms | +5.6 ms |
| Added latency, median | 4 ms | 0 ms | +4 ms |
| Added latency, p95 | 13 ms | 2 ms | +11 ms |
| Added latency, p99 | 50 ms | 3 ms | +47 ms |
| Backend time, median / p95 | 20 / 88 ms | 22 / 87 ms | about the same |
Is the overlap really why it’s fast?
If it is, the extra time should shrink as the backend gets slower. Grouping the checked requests by how long the backend took shows exactly that:
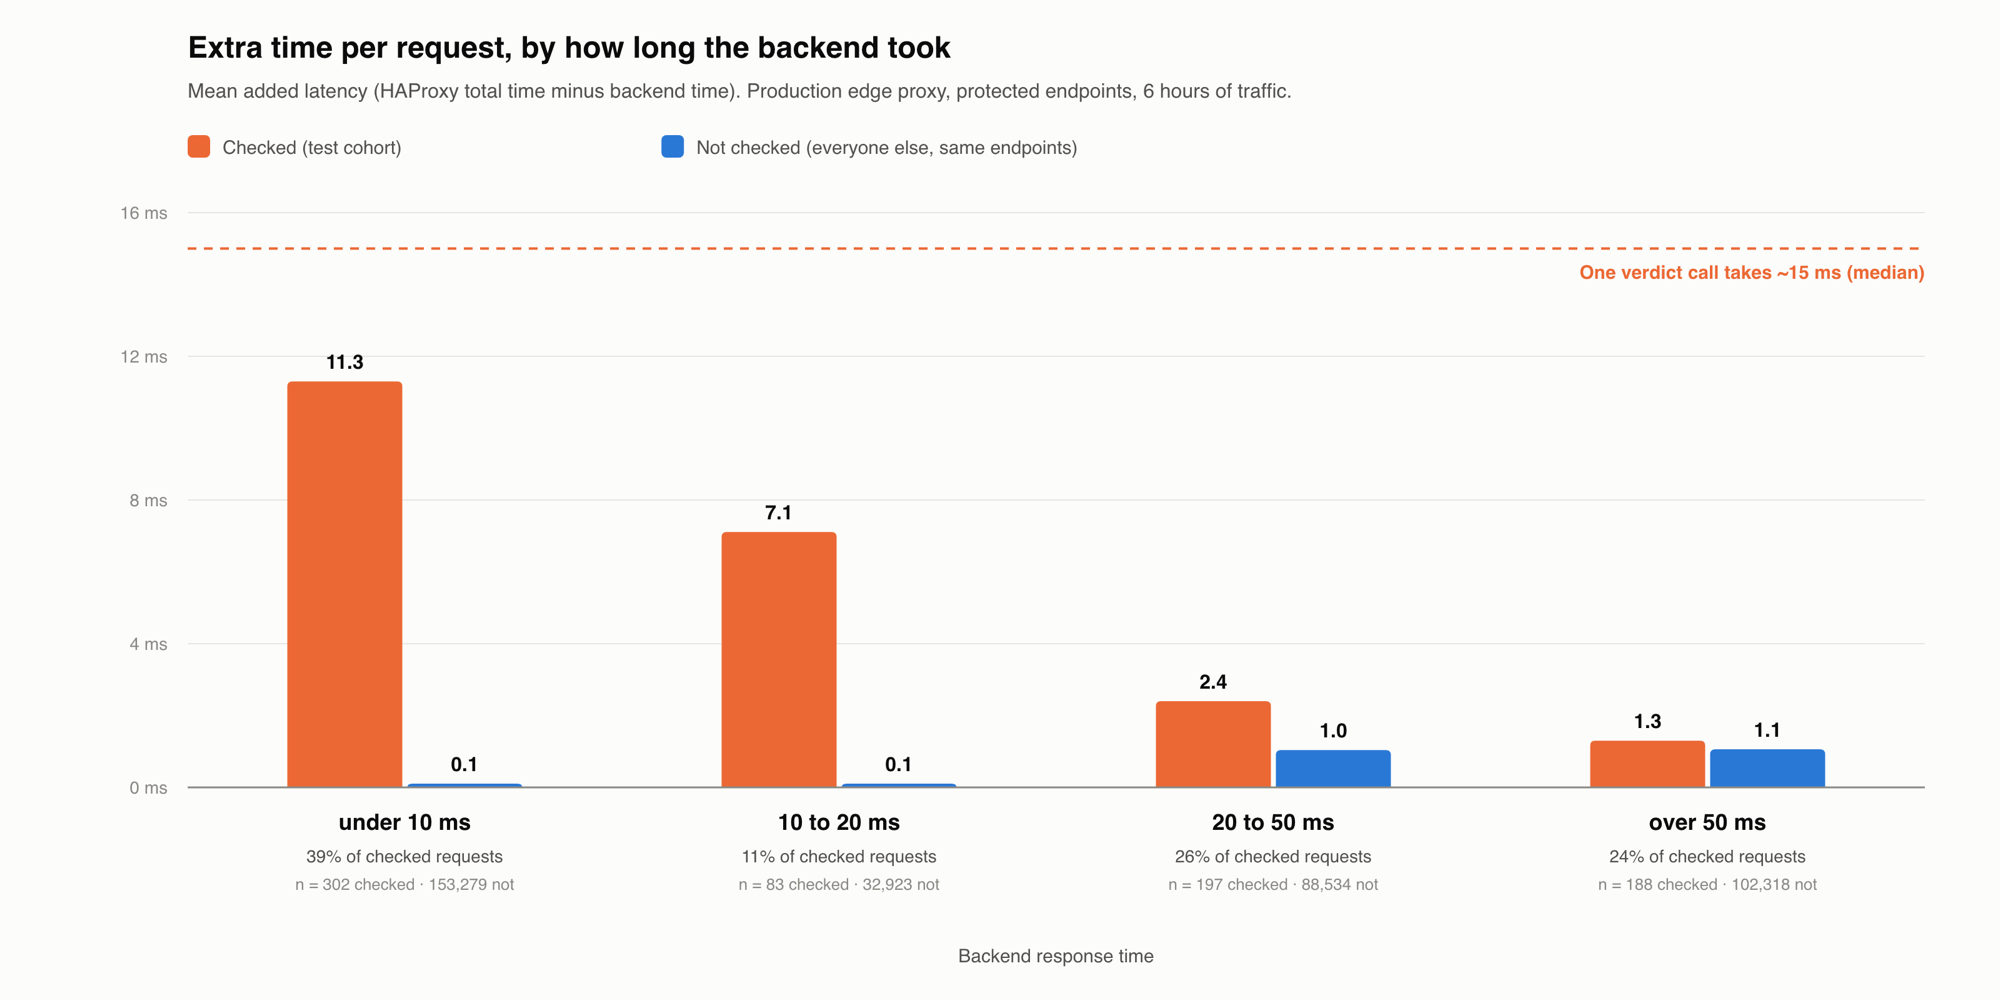
Most of the average comes from the really fast backends. For the half of requests where the backend takes over 20 ms, you can barely see the vendor call at all. Overall, we went from about 14 ms added at the median to about 4 ms.
Counting the traffic (and getting it wrong twice)
Measuring the latency was the easy bit. Working out how many requests were being checked (which is what the vendor charges for) is where I came a cropper. Twice.
Mistake 1: “4 hours of pod logs” was 16 seconds
For a first look I pulled four hours of logs from each proxy pod with kubectl logs --since=4h, counted the checked requests, got a few hundred, and confidently reported “a couple of requests a minute”. Oops. The busy proxies rotate their logs so fast that there were only about 16 seconds of history per pod, and the real rate was about a hundred times higher.
So, check how much time the data you got back actually covers, as well as how much you asked for.
Mistake 2: a few old timestamps threw the maths off
So I measured each pod’s log span from its first and last timestamps instead. That gave about 80k requests a second across the fleet, but Prometheus’s request counter said about 188k, so something was still off. It turns out HAProxy’s %Tl is when the request was accepted, and a handful of long-lived connections get logged when they finally finish, with accept times from ages ago. They made the window look longer than it was, so the rate came out too low.
Trimming the oldest and newest 5% of timestamps, and counting only lines inside that window, gave about 170k a second, which was close enough to Prometheus that I trusted it. Using the same method, checked requests and vendor calls matched up exactly, 1 to 1.
Using an exact counter to scale up sampled logs
Our log pipeline only keeps a sample of access log lines, and nothing counts vendor calls exactly. Prometheus does count every request exactly, though. So, for each hour, I:
- took Prometheus’s exact request count;
- divided it by the number of access log lines the log store kept, which gives the sampling rate (about 1 in 2,020, and steady to within 1% every hour);
- multiplied the sampled count of checked requests by that hour’s rate.
The estimate for the latest hour came out at 77 calls a second, and a live measurement just afterwards showed 78, which was a nice moment. With only about 2,000 sampled checked requests, there’s about ±4% of wobble from the sampling alone, so I made sure to say so in the write-up.
One more surprise along the way: the vendor’s lines in a different log dataset were sampled at a completely different rate from the access lines. I’d assumed it was all one pipeline. It wasn’t!
Caveats
- It’s only in shadow mode so far. Nothing’s been blocked yet, and every verdict has been clean. Blocking should add no time on the parallel path, since the block page just replaces a response we were already holding, but we haven’t tried it in production yet.
- It only helps reads. A checked write still waits for the verdict and pays the full ~15 ms.
- It’s a small test: a small group of users, on a handful of endpoints.
- How much it helps depends on the backend. Really fast endpoints (under 10 ms) still get about 11 ms added, so if it gets rolled out further, it makes sense to start with the slowest ones.
- Every checked request makes its own call, as nothing’s cached between requests. Caching would cut the number of calls (and the bill), but it wouldn’t do much for latency, since the call is already mostly hidden.
What I’d take away from it
- If you’ve got a check that sits in front of your backend, ask whether it really needs to finish before the backend starts. For writes it does. For reads, it only needs to finish before the user sees the result, so you can run it alongside.
- Holding on to the response gives you the same protection for reads, for a fraction of the wait.
- Put a time limit on everything, and let requests through if the check fails. And set your HTTP client’s connect timeout and retries yourself, because the defaults can bite.
- If a setting turns protection off, make it need an exact value, so a typo leaves protection on.
- In HAProxy,
%Ta − %Tris a really handy way to see how much time the proxy added, and it’s already in your logs. - Before counting anything from logs, check how they’re sampled and how much time they really cover. An exact counter (like Prometheus) is great for checking your maths.